Full-time tuition at private ABA-accredited law schools rose 1.5 percent before adjusting for inflation, according to my analysis of (mainly) data released by the ABA in December. I focus on private law school tuition because public law schools receive varying degrees of state subsidies, so they do not reflect the already distorted legal-education market’s prices.
This year’s data release features a revision to the ABA’s collection methodology: providing fees that law schools frequently added to the headline tuition charges. Law schools often give these fees vague names like, “mandatory fees,” which sounds redundant to “tuition.” It’s a phenomenon I noticed very early in my blogging on the topic.
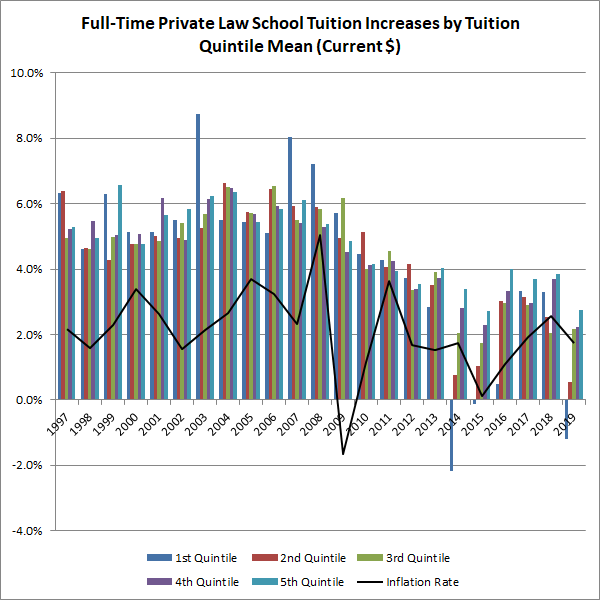
Because of this change to the data-collection methodology, this year’s data should be taken with some skepticism when compared to last year’s because in the past law schools sometimes submitted their tuition and fees as one figure to the ABA and U.S. News while others did not. Now, hopefully, we can compare just the tuition numbers. Consequently, it is possible the change distorts the 1.5 percent annual increase downward. Indeed, the increases in 2019 look less like 2018 and more like 2014 or 2015: increases at expensive law schools and decreases among the cheapest ones. In past years, I hypothesized that these schools were simply too fiscally crunched to afford tuition increases. Perhaps that trend has resumed.
Headline Findings
Separating private law schools into quintiles, here are the increases at the mean of each quintile.
In 2019, the median law school charged $48,825 (between DePaul and Pace). The mean was $49,055 (Washington and Lee).
Very interestingly, law schools shied away from the $70,000 barrier, but they’re getting closer. Last year, America’s most expensive law school, Columbia, charged $69,916, but this year it cut its tuition negligibly to $69,896. In 2018, seventeen law schools were in the $60k club, mean-average of $63,849. This year they now number twenty-two and charge $64,336 on average. They account for ten percent of all law schools (203 at the start of this academic year).
Here’s what the inflation-adjusted dispersion of full-time private and full-time public (resident) tuition looks like going back to 1996:

For the last few years I’ve been eyeballing the 25th-percentile public law school’s resident tuition to see if it will rise above the annual Stafford Loan limit of $20,500. In 2019, the 25th percentile retreated from $20,332 to $20,257 (2019.5 $).
Private Law School Changes
This year no private law school raised its tuition by more than 5 percent, which may be due to market forces or the ABA’s new fee-reporting requirement.
By contrast, eighteen private law schools cut their tuitions this year:
- Columbia (0.0%)
- Quinnipiac (0.0%)
- American (-0.1%)
- Catholic (-0.3%)
- Stanford (-0.3%)
- Western New England (-0.4%)
- Barry (-0.4%)
- Faulkner (-0.5%)
- Washington and Lee (-0.6%)
- Loyola (IL) (-0.8%)
- Baylor (-1.0%)
- Western State (-1.1%)
- Drexel (-1.3%)
- Regent (-1.7%)
- Loyola (LA) (-2.0%)
- Charleston (-2.5%)
- La Verne (-3.0%)
- Liberty (-3.1%)
- Tulane (-4.0%)
- Howard (-4.5%)
- Mississippi College (-4.6%)
- Ave Maria (-5.3%)
- Southern Methodist (-8.7%)
- Oklahoma City (-13.3%)
- Florida Coastal (-13.6%)
And five private law schools kept their costs flat: St. Thomas (FL), Concordia, WMU Cooley, Vermont, and Appalachian. Concordia’s streak extends three years.
Public Law School Changes
Seven public law schools increased their resident tuition by more than 5 percent:
- North Dakota (19.9%)
- Akron (6.9%)
- Montana (6.4%)
- Louisville (6.3%)
- Idaho (6.1%)
- California-Los Angeles (5.2%)
- Southern University (5.2%)
A whopping thirty-four reduced their costs:
- Florida (0.0%)
- Florida State (-0.2%)
- Temple (-0.5%)
- City University (-0.7%)
- California-Davis (-0.8%)
- Indiana (Bloomington) (-0.9%)
- Northern Illinois (-0.9%)
- Utah (-1.3%)
- Alabama (-1.3%)
- Indiana (Indianapolis) (-1.8%)
- New Mexico (-1.9%)
- Maine (-1.9%)
- Penn State (Penn State Law) (-2.1%)
- Maryland (-2.5%)
- Kansas (-3.5%)
- Wayne State (-3.7%)
- Baltimore (-3.8%)
- California-Berkeley (-3.9%)
- Nevada (-4.2%)
- Iowa (-4.2%)
- West Virginia (-4.9%)
- Arizona (-5.1%)
- District of Columbia (-5.5%)
- Colorado (-6.8%)
- Georgia State (-7.5%)
- Toledo (-8.0%)
- Illinois (-8.2%)
- Rutgers (-9.0%)
- SUNY Buffalo (-9.5%)
- George Mason (-10.5%)
- Georgia (-10.7%)
- Arkansas (Little Rock) (-15.1%)
- South Carolina (-17.3%)
- Southern Illinois (-22.4%)
And finally, I have eight law schools that kept their tuitions flat: Florida A&M, Florida International, Hawaii, Cincinnati, South Dakota, North Texas-Dallas, and Texas Southern. (I’m excluding Wyoming because its Web site lists a higher charge per credit this year than last year, indicating misreporting to the ABA.)
Editorial
More important than the headline findings, the ABA continues its practice of reporting impractical, opaque tuition information in its 509 disclosures, even though the process is meant to enable consumers to compare law schools and understand what they are paying for. By supplying their costs in an annualized form, prospective applicants (at least the full-time ones) could usually multiply the numbers by three to arrive at a ballpark estimate of the total cost, even if they could not predict future tuition increases.
Since 2018, however, the ABA has published semester tuition data, which reduces the usefulness of comparisons because some law schools supply useless per-credit tuition numbers. In some cases law schools did not bother reporting to the ABA information I could easily find on their own Web sites—information they readily supplied to U.S. News last year. It’s stunning the ABA went from a clear, intuitive, standardized requirement to one that permits widespread misreporting and consumer confusion.
As a result, as a researcher I have to spend more time than before trying to make these numbers intelligible for readers, and piecing them together from multiple sources reduces the precision the ABA once provided in one format. I will discuss how I determined the tuition figures in the appendix below.
Information on this topic from prior years:
- “2018: Full-Time Private Law-School Tuition Up 3.1 Percent” (January 2, 2019)
- “2018: ABA Publishes Hot Tuition Garbage Instead of Usable Numbers [UPDATED]“
- “2017: Full-Time Private Law School Tuition Up 3.2 Percent” (December 29, 2017)
- “2016: Full-Time Private Law School Tuition Up 2.7 Percent” (December 27, 2016)
- “Full-Time Law School Tuition Still (Slowly) Rising” (December 22, 2015)
- “Law School Cuts Its Tuition to Zero (and Other 509 Report Errata)” (December 15, 2014)
- “The Official Guide is Dead, Long Live the Official Guide!” (March 31, 2014)
********************
Appendix:
The methodology: If a law school’s costs in the ABA’s spreadsheets didn’t vary by more than 5 percent from last year, I left it alone. If it varied by more than that—and it wasn’t clear the school reported its annual tuition or uses an irregular schedule—I looked to see if there was a typo in its 509 report (“509 typo”). If that didn’t work, I’d go to the school’s Web site. If the Web site verified the unusual number in the ABA’s spreadsheet I moved on. Otherwise, I used the annual estimate on the Web site (“Web site override”). If that involved looking at the school’s Web site on the Wayback machine to arrive at its per-credit tuition formula, then I applied that formula to this year’s per-credit numbers (“P/C calc.”). Sometimes that included fees (P/C calc. + fees). In two cases, Wyoming and Inter American, I either couldn’t find their information on their Web sites or derive the calculation, so I used last year’s numbers. I will compare all of these figures to U.S. News‘ results to see if there are any discrepancies. (Last year, I was largely accurate and precise.)
| STATE | SCHOOL | TYPE | 2018 | 2019 PUBLISHED | 2019 ESTIMATED | % CHANGE | OTHER SOURCE |
|---|---|---|---|---|---|---|---|
| Alabama | Alabama | Public | $23,920 | $11,805 | $23,610 | -1.3% | |
| Alabama | Faulkner | Private | $39,184 | $19,500 | $39,000 | -0.5% | |
| Alabama | Samford | Private | $40,150 | $20,394 | $40,788 | 1.6% | |
| Arizona | Arizona | Public | $25,828 | $12,250 | $24,500 | -5.1% | |
| Arizona | Arizona State | Public | $27,584 | $14,029 | $28,058 | 1.7% | |
| Arkansas | Arkansas (Fayetteville) | Public | $16,188 | $0 | $16,604 | 2.6% | Web site override |
| Arkansas | Arkansas (Little Rock) | Public | $15,732 | $0 | $13,351 | -15.1% | 509 Typo |
| California | California Western | Private | $52,470 | $27,080 | $54,160 | 3.2% | |
| California | California-Berkeley | Public | $54,132 | $26,008 | $52,016 | -3.9% | |
| California | California-Davis | Public | $47,722 | $23,666 | $47,332 | -0.8% | |
| California | California-Hastings | Public | $44,326 | $44,480 | $44,480 | 0.3% | |
| California | California-Irvine | Public | $45,098 | $22,789 | $45,578 | 1.1% | |
| California | California-Los Angeles | Public | $45,600 | $23,994 | $47,988 | 5.2% | |
| California | Chapman | Private | $53,124 | $27,359 | $54,718 | 3.0% | |
| California | Golden Gate | Private | $50,000 | $0 | $51,500 | 3.0% | P/C calc. + fees |
| California | La Verne | Private | $31,208 | $15,140 | $30,280 | -3.0% | |
| California | Loyola (CA) | Private | $57,230 | $29,235 | $58,470 | 2.2% | |
| California | Pacific, McGeorge | Private | $51,312 | $26,502 | $53,004 | 3.3% | |
| California | Pepperdine | Private | $55,830 | $28,750 | $57,500 | 3.0% | |
| California | San Diego | Private | $54,640 | $28,115 | $56,230 | 2.9% | |
| California | San Francisco | Private | $49,820 | $25,345 | $50,690 | 1.7% | |
| California | Santa Clara | Private | $54,240 | $0 | $56,280 | 3.8% | P/C calc. |
| California | Southern California | Private | $64,908 | $33,153 | $66,306 | 2.2% | |
| California | Southwestern | Private | $54,166 | $27,658 | $55,316 | 2.1% | |
| California | Stanford | Private | $62,382 | $20,725 | $62,175 | -0.3% | |
| California | Thomas Jefferson | Private | $49,500 | $25,500 | $51,000 | 3.0% | |
| California | Western State | Private | $43,350 | $21,430 | $42,860 | -1.1% | |
| Colorado | Colorado | Public | $31,898 | $14,859 | $29,718 | -6.8% | |
| Colorado | Denver | Private | $50,942 | $26,295 | $52,590 | 3.2% | |
| Connecticut | Connecticut | Public | $30,338 | $15,177 | $30,354 | 0.1% | |
| Connecticut | Quinnipiac | Private | $49,540 | $24,760 | $49,520 | 0.0% | |
| Connecticut | Yale | Private | $64,267 | $66,128 | $66,128 | 2.9% | |
| Delaware | Widener (Delaware) | Private | $50,676 | $0 | $52,120 | 2.8% | P/C calc. + fees |
| District of Columbia | American | Private | $56,724 | $28,342 | $56,684 | -0.1% | |
| District of Columbia | Catholic | Private | $51,560 | $25,700 | $51,400 | -0.3% | |
| District of Columbia | District of Columbia | Public | $12,838 | $6,067 | $12,134 | -5.5% | |
| District of Columbia | George Washington | Private | $60,790 | $31,103 | $62,206 | 2.3% | |
| District of Columbia | Georgetown | Private | $62,244 | $32,274 | $64,548 | 3.7% | |
| District of Columbia | Howard | Private | $34,194 | $16,327 | $32,654 | -4.5% | |
| Florida | Ave Maria | Private | $42,206 | $19,975 | $39,950 | -5.3% | |
| Florida | Barry | Private | $37,430 | $18,640 | $37,280 | -0.4% | |
| Florida | Florida | Public | $21,804 | $10,901 | $21,802 | 0.0% | |
| Florida | Florida A&M | Public | $13,676 | $6,838 | $13,676 | 0.0% | |
| Florida | Florida Coastal | Private | $46,068 | $39,790 | $39,790 | -13.6% | |
| Florida | Florida International | Public | $21,407 | $0 | $21,407 | 0.0% | Web site override |
| Florida | Florida State | Public | $20,694 | $9,036 | $20,643 | -0.2% | P/C calc. |
| Florida | Miami | Private | $52,390 | $26,500 | $53,000 | 1.2% | |
| Florida | Nova Southeastern | Private | $40,950 | $20,895 | $41,790 | 2.1% | |
| Florida | St. Thomas (FL) | Private | $42,190 | $21,095 | $42,190 | 0.0% | |
| Florida | Stetson | Private | $43,880 | $22,234 | $44,468 | 1.3% | |
| Georgia | Atlanta’s John Marshall | Private | $43,736 | $22,065 | $44,130 | 0.9% | |
| Georgia | Emory | Private | $57,348 | $29,531 | $59,062 | 3.0% | |
| Georgia | Georgia | Public | $19,708 | $8,802 | $17,604 | -10.7% | |
| Georgia | Georgia State | Public | $17,050 | $7,884 | $15,768 | -7.5% | |
| Georgia | Mercer | Private | $38,716 | $19,592 | $39,184 | 1.2% | |
| Hawaii | Hawaii | Public | $22,392 | $11,196 | $22,392 | 0.0% | |
| Idaho | Concordia | Private | $30,343 | $0 | $30,343 | 0.0% | P/C calc. |
| Idaho | Idaho | Public | $20,986 | $11,130 | $22,260 | 6.1% | |
| Illinois | Chicago | Private | $65,298 | $22,217 | $66,651 | 2.1% | |
| Illinois | Chicago-Kent, IIT | Private | $47,644 | $24,070 | $48,140 | 1.0% | |
| Illinois | DePaul | Private | $48,166 | $24,335 | $48,670 | 1.0% | |
| Illinois | Illinois | Public | $38,118 | $17,500 | $35,000 | -8.2% | |
| Illinois | John Marshall (Chicago) | Public | $47,500 | $0 | $36,000 | -24.2% | P/C calc. |
| Illinois | Loyola (IL) | Private | $48,962 | $24,285 | $48,570 | -0.8% | |
| Illinois | Northern Illinois | Public | $22,180 | $10,985 | $21,970 | -0.9% | |
| Illinois | Northwestern | Private | $64,402 | $33,253 | $66,506 | 3.3% | |
| Illinois | Southern Illinois | Public | $22,564 | $8,752 | $17,504 | -22.4% | |
| Indiana | Indiana (Bloomington) | Public | $35,588 | $17,638 | $35,276 | -0.9% | |
| Indiana | Indiana (Indianapolis) | Public | $29,198 | $0 | $28,672 | -1.8% | 509 Typo |
| Indiana | Notre Dame | Private | $58,358 | $30,120 | $60,240 | 3.2% | |
| Iowa | Drake | Private | $41,512 | $21,200 | $42,400 | 2.1% | |
| Iowa | Iowa | Public | $27,342 | $13,090 | $26,180 | -4.2% | |
| Kansas | Kansas | Public | $22,562 | $0 | $21,779 | -3.5% | P/C calc. |
| Kansas | Washburn | Public | $22,359 | $35 | $22,591 | 1.0% | P/C calc. |
| Kentucky | Kentucky | Public | $24,046 | $12,361 | $24,722 | 2.8% | |
| Kentucky | Louisville | Public | $21,196 | $11,267 | $22,534 | 6.3% | |
| Kentucky | Northern Kentucky | Public | $20,332 | $10,673 | $21,346 | 5.0% | |
| Louisiana | Louisiana State | Public | $23,660 | $9,875 | $23,669 | 0.0% | Web site override |
| Louisiana | Loyola (LA) | Private | $44,580 | $21,848 | $43,696 | -2.0% | |
| Louisiana | Southern University | Public | $16,530 | $5,669 | $17,394 | 5.2% | Web site override |
| Louisiana | Tulane | Private | $56,572 | $27,155 | $54,310 | -4.0% | |
| Maine | Maine | Public | $23,640 | $11,591 | $23,182 | -1.9% | |
| Maryland | Baltimore | Public | $31,954 | $15,372 | $30,744 | -3.8% | |
| Maryland | Maryland | Public | $33,650 | $16,404 | $32,808 | -2.5% | |
| Massachusetts | Boston College | Private | $54,750 | $28,470 | $56,940 | 4.0% | |
| Massachusetts | Boston University | Private | $55,076 | $27,850 | $55,700 | 1.1% | |
| Massachusetts | Harvard | Private | $64,978 | $33,540 | $67,080 | 3.2% | |
| Massachusetts | Massachusetts — Dartmouth | Public | $28,526 | $14,330 | $28,660 | 0.5% | |
| Massachusetts | New England | Private | $49,488 | $25,444 | $50,888 | 2.8% | |
| Massachusetts | Northeastern | Private | $50,700 | $26,400 | $52,800 | 4.1% | |
| Massachusetts | Suffolk | Private | $48,090 | $24,705 | $49,410 | 2.7% | |
| Massachusetts | Western New England | Private | $42,218 | $21,029 | $42,058 | -0.4% | |
| Michigan | Detroit Mercy | Private | $43,820 | $0 | $44,900 | 2.5% | P/C calc. + fees |
| Michigan | Michigan | Public | $59,762 | $30,763 | $61,526 | 3.0% | |
| Michigan | Michigan State | Private | $44,200 | $22,800 | $45,600 | 3.2% | |
| Michigan | Wayne State | Public | $32,882 | $15,833 | $31,666 | -3.7% | |
| Michigan | WMU Cooley | Private | $50,790 | $0 | $50,790 | 0.0% | P/C calc. + fees |
| Minnesota | Minnesota | Public | $42,840 | $21,852 | $43,704 | 2.0% | |
| Minnesota | Mitchell|Hamline | Private | $43,460 | $22,490 | $44,980 | 3.5% | |
| Minnesota | St. Thomas (MN) | Private | $41,442 | $21,149 | $42,298 | 2.1% | |
| Mississippi | Mississippi | Public | $16,550 | $8,435 | $16,870 | 1.9% | |
| Mississippi | Mississippi College | Private | $35,510 | $16,935 | $33,870 | -4.6% | |
| Missouri | Missouri (Columbia) | Public | $21,192 | $10,795 | $21,590 | 1.9% | |
| Missouri | Missouri (Kansas City) | Public | $19,701 | $0 | $20,257 | 2.8% | Web site override |
| Missouri | St. Louis | Private | $42,154 | $21,270 | $42,540 | 0.9% | |
| Missouri | Washington University | Private | $57,446 | $29,400 | $58,800 | 2.4% | |
| Montana | Montana | Public | $13,176 | $7,007 | $14,014 | 6.4% | |
| Nebraska | Creighton | Private | $40,096 | $20,747 | $41,494 | 3.5% | |
| Nebraska | Nebraska | Public | $16,084 | $0 | $16,423 | 2.1% | Web site override |
| Nevada | Nevada | Public | $27,022 | $12,950 | $25,900 | -4.2% | |
| New Hampshire | New Hampshire | Public | $37,406 | $19,000 | $38,000 | 1.6% | |
| New Jersey | Rutgers | Public | $28,358 | $12,902 | $25,804 | -9.0% | |
| New Jersey | Seton Hall | Private | $54,090 | $27,424 | $54,848 | 1.4% | |
| New Mexico | New Mexico | Public | $17,398 | $8,532 | $17,064 | -1.9% | |
| New York | Albany | Private | $47,450 | $24,812 | $49,624 | 4.6% | |
| New York | Brooklyn | Private | $60,236 | $0 | $61,550 | 2.2% | Web site override |
| New York | Cardozo, Yeshiva | Private | $59,940 | $30,869 | $61,738 | 3.0% | |
| New York | City University | Public | $15,564 | $7,725 | $15,450 | -0.7% | |
| New York | Columbia | Private | $69,916 | $34,948 | $69,896 | 0.0% | |
| New York | Cornell | Private | $65,541 | $67,748 | $67,748 | 3.4% | |
| New York | Fordham | Private | $60,406 | $30,885 | $61,770 | 2.3% | |
| New York | Hofstra | Private | $59,214 | $30,127 | $60,254 | 1.8% | |
| New York | New York Law School | Private | $51,732 | $26,276 | $52,552 | 1.6% | |
| New York | New York University | Private | $66,422 | $34,467 | $68,934 | 3.8% | |
| New York | Pace | Private | $48,614 | $24,500 | $49,000 | 0.8% | |
| New York | St. John’s | Private | $59,480 | $30,575 | $61,150 | 2.8% | |
| New York | SUNY Buffalo | Public | $28,074 | $12,705 | $25,410 | -9.5% | |
| New York | Syracuse | Private | $51,422 | $25,750 | $51,500 | 0.2% | |
| New York | Touro | Private | $49,800 | $25,430 | $50,860 | 2.1% | |
| North Carolina | Campbell | Private | $41,130 | $42,600 | $42,600 | 3.6% | |
| North Carolina | Duke | Private | $64,722 | $33,000 | $66,000 | 2.0% | |
| North Carolina | Elon | Private | $38,000 | $15,380 | $38,450 | 1.2% | |
| North Carolina | North Carolina | Public | $24,172 | $10,571 | $24,480 | 1.3% | Web site override |
| North Carolina | North Carolina Central | Public | $18,738 | $6,722 | $18,823 | 0.5% | Web site override |
| North Carolina | Wake Forest | Private | $45,360 | $23,134 | $46,268 | 2.0% | |
| North Dakota | North Dakota | Public | $13,024 | $15,617 | $15,617 | 19.9% | |
| Ohio | Akron | Public | $22,646 | $12,107 | $24,214 | 6.9% | |
| Ohio | Capital | Private | $38,290 | $0 | $39,220 | 2.4% | P/C calc. + fees |
| Ohio | Case Western Reserve | Private | $52,070 | $26,750 | $53,500 | 2.7% | |
| Ohio | Cincinnati | Public | $24,010 | $24,010 | $24,010 | 0.0% | |
| Ohio | Cleveland State | Public | $27,210 | $13,877 | $27,754 | 2.0% | |
| Ohio | Dayton | Private | $34,580 | $209 | $35,003 | 1.2% | P/C calc. |
| Ohio | Ohio Northern | Private | $29,160 | $15,100 | $30,200 | 3.6% | |
| Ohio | Ohio State | Public | $30,848 | $31,450 | $31,450 | 2.0% | |
| Ohio | Toledo | Public | $21,896 | $10,067 | $20,134 | -8.0% | |
| Oklahoma | Oklahoma | Public | $20,904 | $10,752 | $21,504 | 2.9% | |
| Oklahoma | Oklahoma City | Private | $35,630 | $15,443 | $30,886 | -13.3% | |
| Oklahoma | Tulsa | Private | $25,254 | $12,669 | $25,338 | 0.3% | |
| Oregon | Lewis and Clark | Private | $46,370 | $24,086 | $48,172 | 3.9% | |
| Oregon | Oregon | Public | $35,418 | $17,802 | $35,604 | 0.5% | |
| Oregon | Willamette | Private | $44,380 | $22,765 | $45,530 | 2.6% | |
| Pennsylvania | Drexel | Private | $45,270 | $0 | $44,660 | -1.3% | P/C calc. |
| Pennsylvania | Duquesne | Private | $44,944 | $23,062 | $46,124 | 2.6% | |
| Pennsylvania | Penn State (Dickinson Law) | Public | $50,582 | $26,263 | $52,526 | 3.8% | |
| Pennsylvania | Penn State (Penn State Law) | Public | $50,984 | $24,948 | $49,896 | -2.1% | |
| Pennsylvania | Pennsylvania | Private | $65,804 | $33,999 | $67,998 | 3.3% | |
| Pennsylvania | Pittsburgh | Public | $34,834 | $17,481 | $34,962 | 0.4% | |
| Pennsylvania | Temple | Public | $27,104 | $13,490 | $26,980 | -0.5% | |
| Pennsylvania | Villanova | Private | $46,536 | $23,680 | $47,360 | 1.8% | |
| Pennsylvania | Widener (Commonwealth) | Private | $45,750 | $0 | $47,130 | 3.0% | P/C calc. |
| Puerto Rico | Inter American | Private | $16,645 | $0 | $16,645 | 0.0% | Used 2018’s |
| Puerto Rico | Pontifical Catholic | Private | $15,738 | $7,924 | $15,848 | 0.7% | |
| Puerto Rico | Puerto Rico | Public | $6,144 | $3,850 | $7,700 | 25.3% | |
| Rhode Island | Roger Williams | Private | $36,814 | $18,762 | $37,524 | 1.9% | |
| South Carolina | Charleston | Private | $42,134 | $20,550 | $41,100 | -2.5% | |
| South Carolina | South Carolina | Public | $29,608 | $9,653 | $24,472 | -17.3% | Web site override |
| South Dakota | South Dakota | Public | $17,000 | $8,500 | $17,000 | 0.0% | |
| Tennessee | Belmont | Private | $44,470 | $22,570 | $45,140 | 1.5% | |
| Tennessee | Lincoln Memorial | Private | $36,840 | $18,750 | $37,500 | 1.8% | |
| Tennessee | Memphis | Public | $19,198 | $9,609 | $19,218 | 0.1% | |
| Tennessee | Tennessee | Public | $19,674 | $8,348 | $20,168 | 2.5% | Web site override |
| Tennessee | Vanderbilt | Private | $57,558 | $29,775 | $59,550 | 3.5% | |
| Texas | Baylor | Private | $62,421 | $20,594 | $61,782 | -1.0% | |
| Texas | Houston | Public | $32,093 | $16,590 | $33,180 | 3.4% | |
| Texas | North Texas-Dallas | Public | $9,107 | $9,107 | $9,107 | 0.0% | |
| Texas | South Texas-Houston | Private | $32,400 | $16,725 | $33,450 | 3.2% | |
| Texas | Southern Methodist | Private | $54,094 | $24,702 | $49,404 | -8.7% | |
| Texas | St. Mary’s | Private | $37,410 | $18,915 | $37,830 | 1.1% | |
| Texas | Texas | Public | $35,714 | $18,214 | $36,428 | 2.0% | |
| Texas | Texas A&M [Wesleyan] | Public | $31,000 | $15,628 | $31,256 | 0.8% | |
| Texas | Texas Southern | Public | $20,418 | $10,209 | $20,418 | 0.0% | |
| Texas | Texas Tech | Public | $26,840 | $11,295 | $26,904 | 0.2% | Web site override |
| Utah | Brigham Young | Private | $26,120 | $13,450 | $26,900 | 3.0% | |
| Utah | Utah | Public | $28,354 | $13,999 | $27,998 | -1.3% | |
| Vermont | Vermont | Private | $48,254 | $24,127 | $48,254 | 0.0% | |
| Virginia | Appalachian | Private | $35,500 | $17,750 | $35,500 | 0.0% | |
| Virginia | George Mason | Public | $25,354 | $11,351 | $22,702 | -10.5% | |
| Virginia | Liberty | Private | $36,862 | $17,856 | $35,712 | -3.1% | |
| Virginia | Regent | Private | $36,620 | $18,000 | $36,000 | -1.7% | |
| Virginia | Richmond | Private | $44,700 | $23,200 | $46,400 | 3.8% | |
| Virginia | Virginia | Public | $60,700 | $31,600 | $63,200 | 4.1% | |
| Virginia | Washington and Lee | Private | $49,356 | $24,538 | $49,076 | -0.6% | |
| Virginia | William and Mary | Public | $34,000 | $17,500 | $35,000 | 2.9% | |
| Washington | Gonzaga | Private | $40,665 | $0 | $42,540 | 4.6% | P/C calc. |
| Washington | Seattle | Private | $46,586 | $0 | $48,418 | 3.9% | P/C calc. + fees |
| Washington | Washington | Public | $35,988 | $11,985 | $37,050 | 3.0% | Web site override |
| West Virginia | West Virginia | Public | $24,084 | $11,457 | $22,914 | -4.9% | |
| Wisconsin | Marquette | Private | $46,170 | $23,775 | $47,550 | 3.0% | |
| Wisconsin | Wisconsin | Public | $23,518 | $12,118 | $24,236 | 3.1% | |
| Wyoming | Wyoming | Public | $16,350 | $0 | $16,350 | 0.0% | Used 2018’s |
Fin.