

We have been asked to find cost-savings in our 2020 budget. Unlike when an organization prioritizes spending, this amounts to going through budget lines and identifying whether our budget requests and our year end actuals are actually in alignment. As I was looking through our numbers, it seemed to make sense to make sure that we were looking for patterns as well as details before making cuts.
I’m going to assume that if you’re reading something boring about budgets, you may be new to law library budgeting. For the more seasoned readers, you may just be curious about the nuances of our library.
This sort of budget cut is trickier than the one that is focused on a service. Although the approach is to be somewhat fair – every organizational unit cuts 1% – 2% of budget – it ignores the differences in how units use their resources. It can mean that the outcomes are much more unequal than the dollars saved reflect.
The better approach for a law library manager is to proactively look at project or service costs. For example, our library app has a set annual cost to maintain. Since it’s discrete, I can keep or cancel without impacting other services. It – and our remote access HeinOnline subscription – were two items I initially put on our potential cuts list. It’s less arbitrary than reducing multiple operational budget lines in ways that may hide the fact that you no longer are fully funding delivery of a given service.
Let’s start by looking at the big categories, to see how they shake out. I’ve got until June 20 to make these changes, so the faster I can identify the most likely areas, the better. I’m going to use Microsoft Excel for the analysis, since we don’t have a financial reporting system with legacy data.
Understand Your Limitations
If you are daunted by managing a law library with a large budget, don’t be. I used to think running a multi-million dollar law library was going to be really challenging. There are challenges, but a huge amount of your budget is non-discretionary for most purposes.
One particular challenge in law libraries is that funders and governance boards made up of lawyers often may not have any budget experience. They may direct you to cut from the largest funding category without understanding the impact of doing so.
Here’s what I mean. We have 5 main categories in our general ledger, including revenue income.
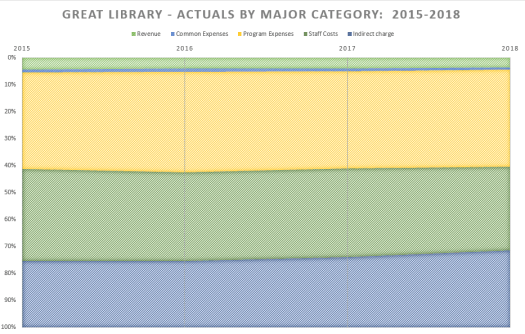
I’ll describe them in relation to the graph above, which shows our actual spend each year from 2015 to 2018 by major category as a percentage of the total:
- Revenue. Our revenue is pretty stable and relies primarily on photocopying income and a large grant that is renegotiated every 5 years. The grant accounts for about 90% of the revenue. Revenue is speculative, in most cases. It doesn’t factor in to budget cuts unless you (a) have enough time to plan for it and (b) you have some certainty it will actually exist, and can offset cuts.
- Common Expenses. After Revenue, this is our smallest budget category. Office supplies, professional memberships, and other odds and ends of basic library operations.
- Program Expenses. That’s corporate speak for collections. Not surprisingly, it’s the largest budget expense. In our case, it also include tattle tapes, rebinding, and other collection-related expenses.
- Staff Costs. Salaries and benefits for a ~20 person staff. These are set by HR and not accessible for budget cuts without position elimination.
- Indirect Charge. This is a central calculation applied to our budget that is a charge back for IT, HR, Facilities, and other corporate support.
Note: I realize that this incorporates both income and expenses to achieve 100%. I just wanted to compare the amounts. It might be clearer to have the revenue appear as negative, since it is an offset to your expenses.
For the purposes of this budget cut, then, I have four potential expense categories from which to find savings. Even with more time, I doubt that I could find a revenue generating service that could offset the cuts.
The indirect charge is inaccessible to me, since I can’t decide those costs. Staff costs are essentially inaccessible. You could conceivably eliminate a position for cost savings. But I’m only looking for 1%-2% and a person costs way more than that in straight dollars. It would also have a negative impact on morale, require severance costs that might negate the savings, never mind the impact on the person let go.
Even if you have an empty position, I’d caution on eliminating it unless you were involved in a more significant – and preferably focused – budget reduction. We have eliminated a number of positions over the years. When we did a recent assessment and estimated our reference coverage was at about 70% for the hours we operate, we asked for a new position. Our request was denied. Lesson: if you give it up, you may never get it back.
Long story short: I’m going to be making cuts from either my smallest (Common) or largest (Program) expenses to meet a 1%-2% budget cut. That’s too bad, since our annual operations increases have been in that range anyway. This cut will probably eliminate 2 years of operational increases, such as they were.
The Forest and the Trees
Now what I’m going to search for are the variances. If I’m budgeted X for the year and I overspend, I should have a negative variance. If I underspend, I’ll have a positive variance. But don’t start looking at the detail until you’ve considered the broad picture.
The forest, in this case, are your major categories. If you look at just one year of your categories, you may get a false sense of what your trends have been in spending. If you look at the specific budget lines, you may lose sight that positive variances in one area are offsetting negative variances in another.
Many non-commercial organizations have a spend-to-zero approach. If you don’t spend it, you may not get it next year. It’s fiduciarily irresponsible but it is reinforced in organizations that do not provide any reward for being fiscally responsible. As we learned with our staff position, need isn’t driving decisions. But if you run your own standalone law library, you should attempt to reward when budget managers reduce their asks, by helping them when they look for increases based on need.
Let’s look at those five categories again. This time, we are not looking at what their actual spend was. This chart reflects what their variance from their budgeted amount is.

Our revenue has been falling and, as such, has been offsetting fewer of our expenses. Staff costs have recently gone into negative variance (overspending) but those are outside my control, since they’re set by HR.
Unfortunately, the indirect charge has one of the largest variances but won’t help me with budget cutting. Hopefully those departments will be making their own cuts and bringing those variances in closer alignment with actuals.
How do you calculate variances? Create one column with your actuals A. Create a second column with your budget amounts B. Create a third column for your variances V, which are equal to A-B (in Excel-speak, type in the cell “=A-B” swapping in the cell names (eg., E23, F23) for A and B). To figure out percentages, I used this equation, which accounts for negative numbers: “=V/(A+ABS(V))” which uses the absolute value of the variance.
Our collections (Program) expenses are the grey bar. There was a small variance in 2015 that has grown through 2017 and is now falling back. This is one reason why it’s important to look at trends.
On its face, our 2018 budget will have positive variances in our collection that will suggest reduction. But we had a specific budgetary infusion in 2016-2018 for our collection. This variance, then, reflects both simultaneous collection cutting by our acquisitions and reference teams as well as that increased collection funding.
It is 18 months between when we budget and when we see the actual year-end spending for a budget year. I’ll finalize our budget in the next few weeks for 2020 and it will then go through a 6 month approval process. If it’s approved, I’ll know in mid-January of 2021 what our variances were for 2020.
The most obvious thing about this chart, though, is that Common expenses, although our smallest line, also has the largest variance. Fortunately, it should mean that cost savings will have the least impact as I true those lines up with actual costs. This is where I’m going to try to extract our cuts.
But now I want to see whether there is trending data on those variances at the budget line level.
Out of Control Growth
If you haven’t used conditional formatting yet, I’d encourage you to look into it. I find it one of the best ways to look at law library metrics – collection usage, budget, etc. – in a quick and visual way. In order to get my variances by category, I started with variances by budget line. Then I rolled it up to see the categories I discussed above.
Now it’s time to return to that detail. Here’s a snapshot of part of our Common Expenses with annual variances (2015-2018). Green variances are large and positive, red are negative, and yellow are small positive variances.
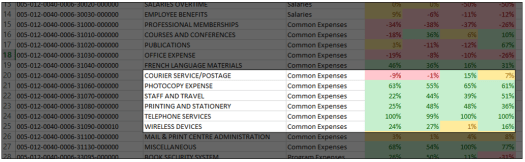
The highlighted portion of that spreadsheet shows that, in every year, those budget lines were under-spent. The higher the percentage, the more it was underspent. Unfortunately, none of them are high dollar areas.
But at least I can start to focus on the areas that have been trending positive variances every year and are unlikely to change in the next 18 months. While the recommendations from our Finance team are to make cuts in many of the lines with positive variances, you can see that some budget lines fluctuate up and down around their budgeted amount more than others.
The next steps will be to recalibrate all of the spending in this area so that the 2020 budget request is better aligned with actual spending. Once I know that the overspent lines are taken care of (excess funding moved into those lines) I can then make cuts from the lines that are still under-spent.