The aim of this analysis is to give a better understanding of how the distribution of NDIS registered providers differs by state. The data is provided by NDIS data.
Providers by state
As of December 2019 there were a total of 13,986 NDIS registered providers. Analysing this by state we see the following break down
| State | Number of Providers |
| New South Wales (NSW) | 6764 |
| Queensland (QLD) | 4490 |
| Victoria (VIC) | 4531 |
| South Australia (SA) | 1586 |
| Western Australia (WA) | 1098 |
| Australian Capital Territory (ACT) | 933 |
| Tasmania (TAS) | 900 |
| Northern Territory (NT) | 420 |
From the table above it’s clear that NSW has the largest number of registered NDIS providers followed by Queensland, Victoria then South Australia.
Providers by Disability Groups and State
In this section we analyse the distribution of disability per state to understand how each state differs by the type of disability.
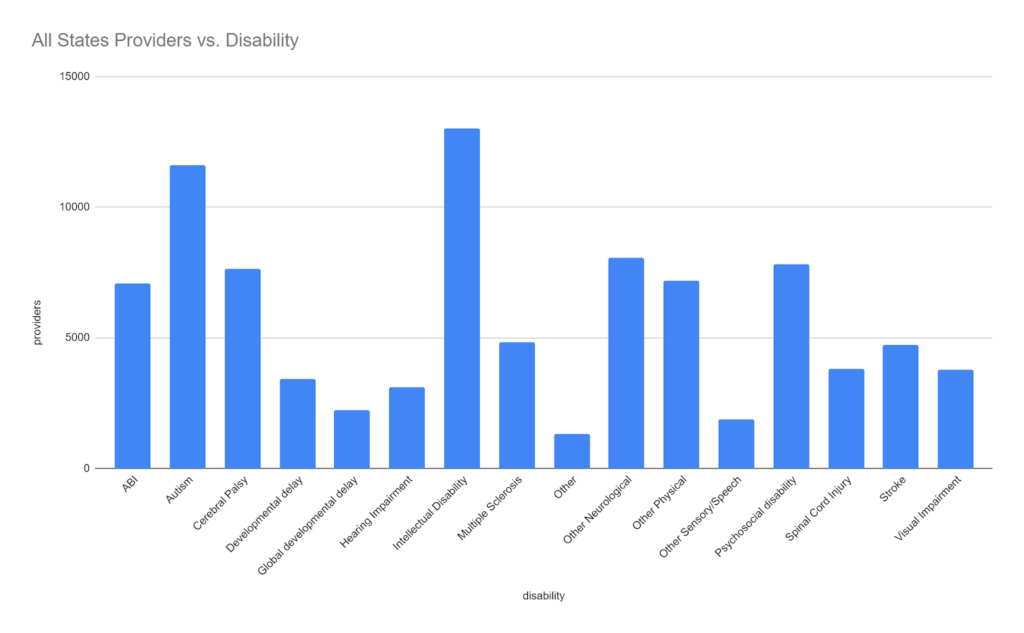
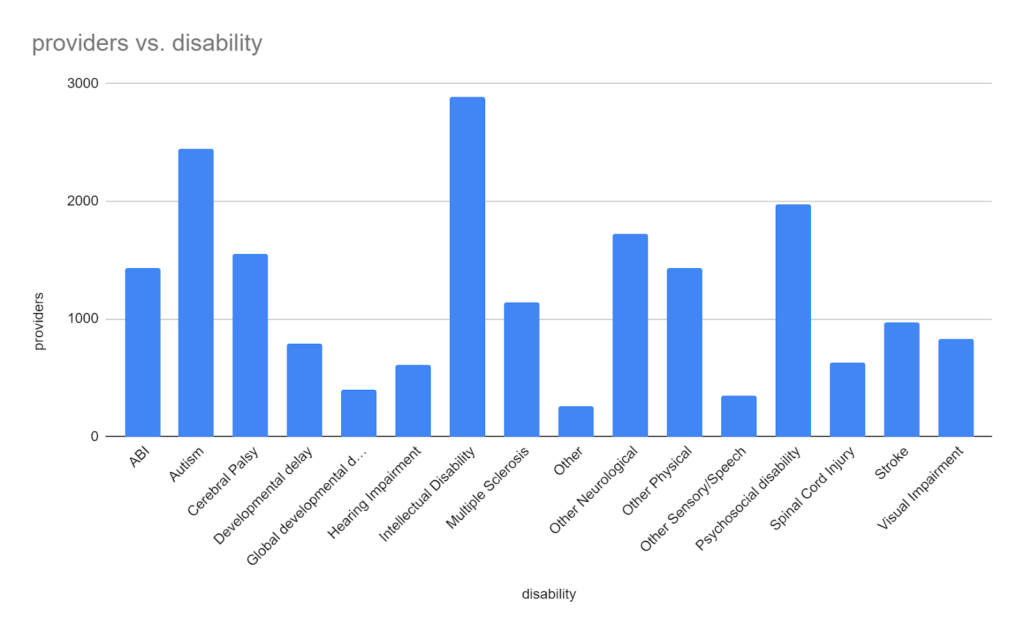
Looking at the overall distribution of disabilities we see that intellectual disability providers are by far the most common followed by Autism support providers then other neurological support providers.
Analysing this data by state
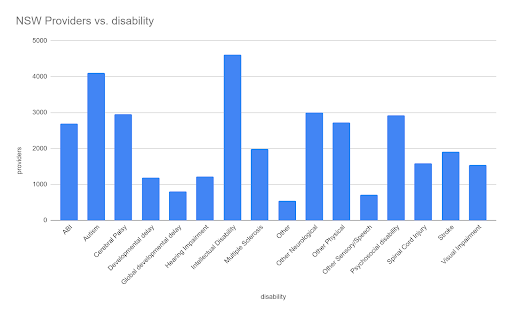
NSW shows a similar pattern with majority of providers offering intellectual support followed by Autism
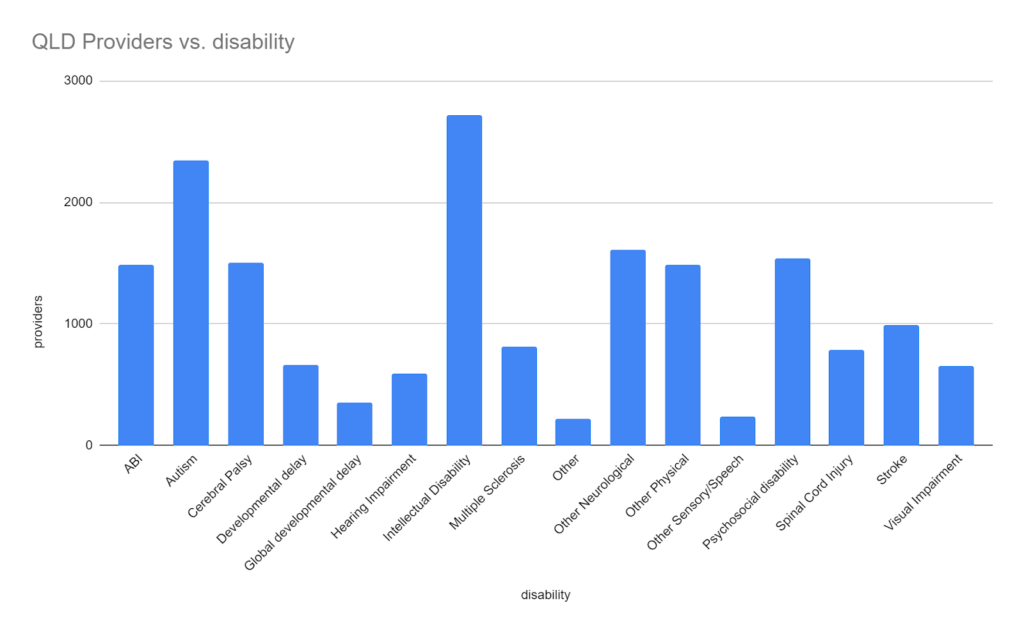
QLD also shows a similar pattern with the majority of providers offering intellectual support followed by Autism albeit a lot less providers overall.
VIC shows a similar pattern for intellectual and Autism but we see a hugher representation of psychosocial disability providers which may indicate higher demand for these services in the region.
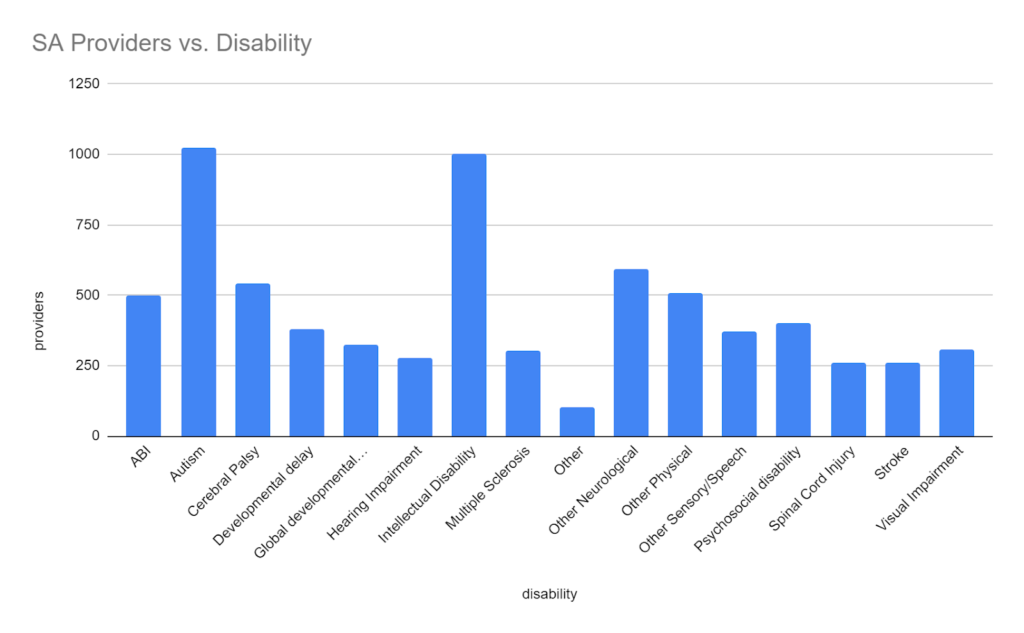
SA on the other hand shows a very different distribution compared to the rest of the states. South Australia has a higher concentration of Autism support providers than intellectual disability.
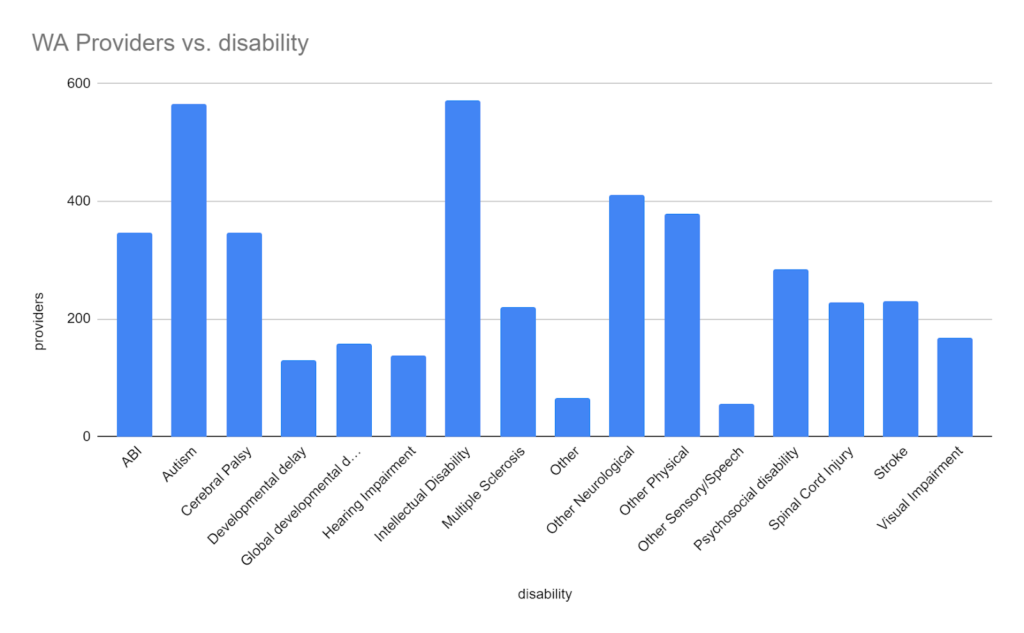
WA is quite similar to SA with the number of Autism providers very similar to intellectual disability. The main difference is that WA has a slightly higher number of Intellectual disability providers 572 vs 565.
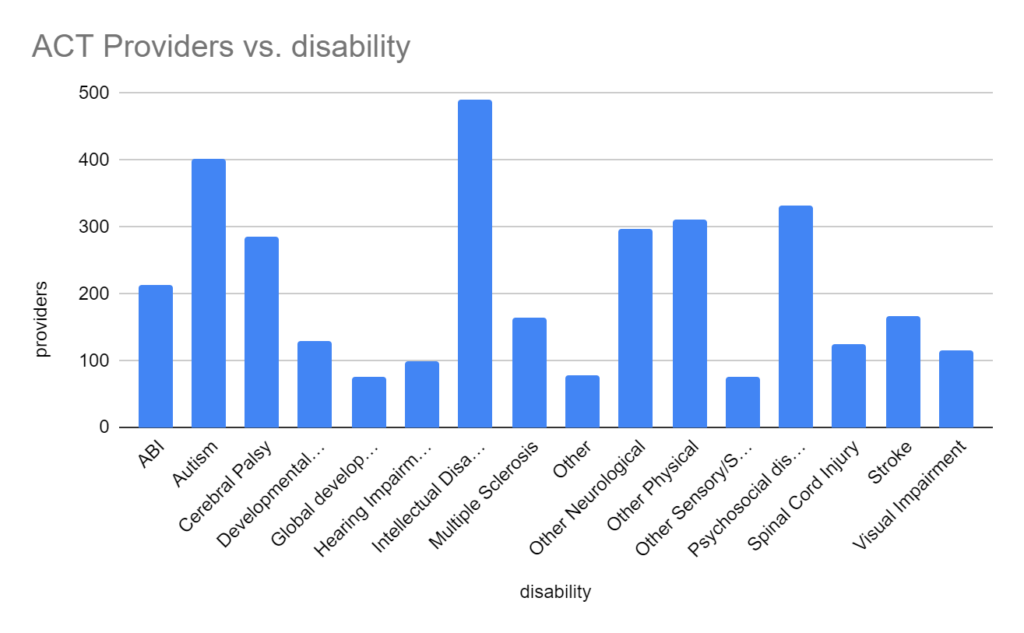
ACT’s distribution of providers by disability support closely matches the overall distribution. Even though the state is the smallest geographically the number of providers in the region is high.
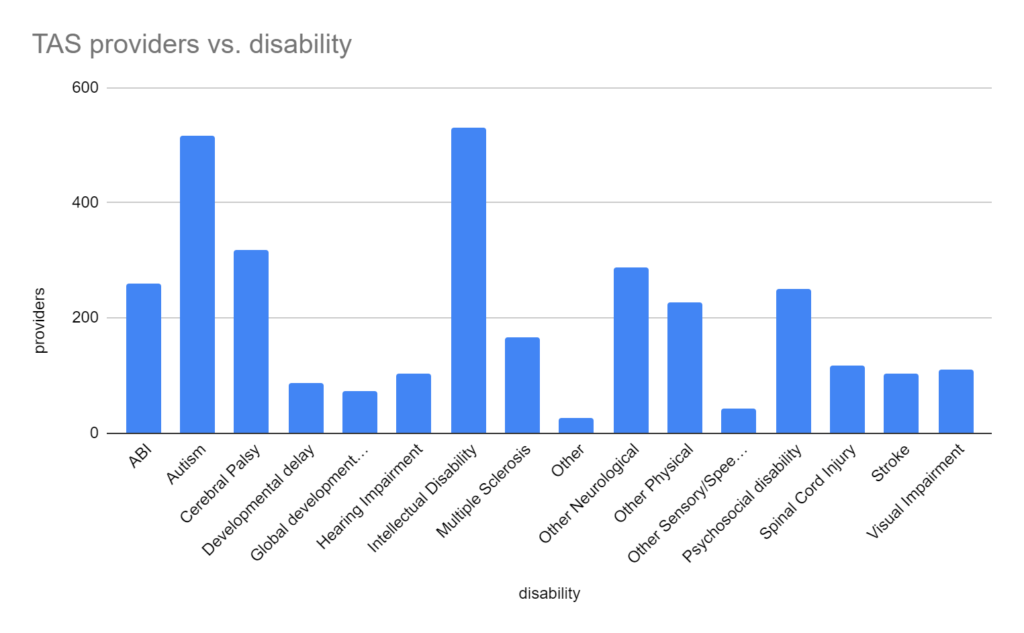
TAS also follows a similar distribution to the rest of Australia for the top 3 disability groups by provider.
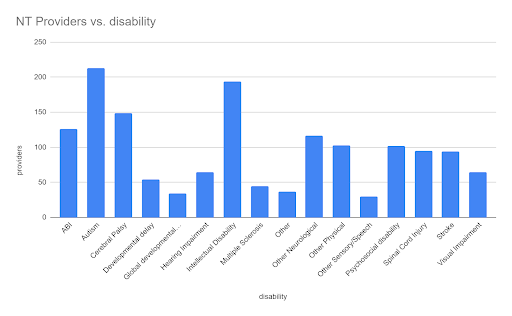
NT has a higher number of Autism support providers than intellectual disability. This is similar to SA. NT also has the lowest number of providers across all states.
The post A breakdown of registered NDIS providers by disability group in each state. appeared first on NDIS Registered Providers.